Dead Miles in NEMT: What They Are and How to Reduce Them in 2026
There is a cost hiding inside every NEMT operation that most providers never fully quantify and it is eating into their margins every single day. It shows up on every schedule, on every route, and in every driver’s shift. It does not generate a single dollar of revenue. And for most small-to-medium NEMT providers, it represents somewhere between 15 and 30 percent of their total miles driven.
It is called dead miles and understanding, tracking, and reducing it is one of the highest-leverage improvements any NEMT operator can make to their profitability.
What Are Dead Miles in NEMT?
Dead miles sometimes called deadhead miles are the miles a driver travels between completing one trip and beginning the next one. Specifically, they are the miles driven from the drop-off location of one patient to the pickup location of the next patient assigned to that driver.
These miles cost your business real money. Your driver is on the clock. Your vehicle is burning fuel. Your insurance exposure is active. But no broker is paying you for those miles and no patient is in the vehicle generating revenue. Every dead mile your fleet accumulates is pure cost with zero corresponding revenue.
On a fleet of 10 vehicles completing 80 trips per day, dead miles can easily represent 200 to 400 miles of daily driving. At an all-in cost of $0.80 to $1.20 per mile when you account for fuel, driver time, and vehicle wear that is $160 to $480 of daily cost that generates nothing. Over a month, that is $3,200 to $9,600 of margin erosion that never appears on a revenue report but shows up clearly in your bank account.
Why Most NEMT Providers Don’t Track Dead Miles
The honest answer is that most NEMT dispatch systems particularly manual systems and general scheduling tools not built specifically for NEMT do not calculate dead miles automatically. Without automatic calculation, tracking dead miles requires manually mapping the gap between every trip drop-off and the next pickup for every driver every day. That is hours of work that most operators simply do not have time for.
The result is that most NEMT providers know their total revenue and their total trips but have no accurate picture of their actual profit margins per driver, per route, or per account. They know roughly what they are making but cannot identify precisely where they are losing money or which accounts are actually profitable after dead mile costs are factored in.
This is a significant strategic blind spot. It means routing and scheduling decisions get made based on incomplete financial information and optimization opportunities worth thousands of dollars per month go unaddressed because no one knows they exist.
How to Calculate Your Dead Miles
Calculating dead miles manually requires identifying the distance between the drop-off location of each completed trip and the pickup location of the immediately following trip assigned to the same driver, for every driver, for every day.
The formula is straightforward: Dead Miles = Distance from Trip A Drop-off to Trip B Pickup, summed across all consecutive trip pairs for each driver across your entire schedule.
As a baseline benchmark, a well-optimized NEMT schedule typically produces dead miles equal to 10 to 15 percent of total billable miles driven. If your dead miles are running at 20 percent or higher, your scheduling and routing has significant optimization opportunity. If you have never measured your dead miles at all, the first measurement is almost always a significant and motivating number.
5 Proven Strategies to Reduce Dead Miles
Strategy 1 Geographic Clustering of Trip Assignments The most impactful dead mile reduction strategy is assigning trips to drivers based on geographic proximity keeping each driver’s daily schedule concentrated in a specific zone or corridor rather than sending them across your entire service area throughout the day. A driver whose trips are all within a 5-mile radius will accumulate dramatically fewer dead miles than a driver whose schedule bounces between opposite ends of your service territory.
This requires intentional scheduling rather than first-come-first-served assignment. When a new trip request comes in, assign it to the driver whose current location or scheduled drop-off is geographically closest to the new pickup not simply to whoever has availability in the time window.
Strategy 2 Optimize Your Schedule the Night Before Dead miles accumulate most in schedules that are built reactively throughout the day rather than planned comprehensively the night before. When you schedule reactively assigning each new trip as it arrives without a view of the full day you lose the ability to sequence trips efficiently.
Building your schedule 12 to 24 hours in advance gives you a complete picture of the day’s trip volume and geographic distribution, allowing you to sequence each driver’s trips in a logical geographic flow that minimizes the gap between each drop-off and the next pickup.
Strategy 3 Use Return Trip Pairing When a driver drops off a patient at a medical facility, there is often an opportunity to pick up a different patient from that same facility for a return trip home. Actively looking for and matching these return trip pairings patients leaving a facility at roughly the same time a driver is arriving with another patient can eliminate entire segments of dead mileage that would otherwise occur between the drop-off and the next assigned pickup.
This requires visibility into your full trip schedule across all drivers simultaneously — which is exactly what a visual dispatch calendar provides and the routing flexibility to match returning patients to incoming drivers in real time.
Strategy 4 Track Dead Miles by Driver and Account Not all dead miles are created equal. Some drivers consistently accumulate more dead miles than others because of how their schedules are structured or how they route between trips. Some broker accounts generate disproportionately high dead miles because the pickup and drop-off locations are geographically isolated from your other trip clusters.
Tracking dead miles broken down by driver and by account gives you the data to make targeted optimization decisions. You might discover that one specific broker account generates 40 percent of your dead miles while representing only 15 percent of your revenue — information that fundamentally changes how you value and prioritize that account relationship.
Strategy 5 Implement NEMT Software With Automatic Dead Mile Calculation All four of the strategies above are significantly more effective and in some cases only practically executable when your dispatch software automatically calculates dead miles in real time as you build your schedule. Manual dead mile tracking creates a data lag that makes optimization reactive rather than proactive.
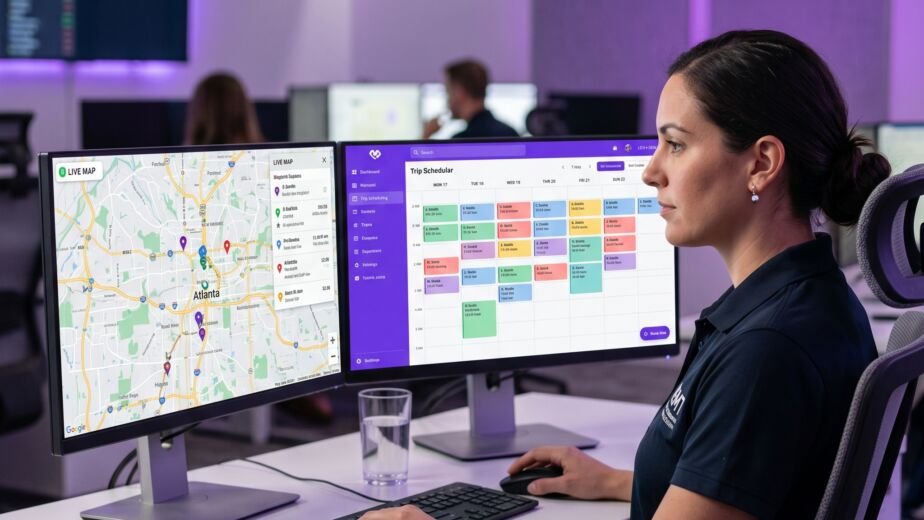
ActiveRoute automatically calculates dead miles for every consecutive trip pair in your schedule, surfacing the data by driver, by account, and by date range in the reporting dashboard. You can see your total dead miles for the day updating in real time as you build the schedule — which means you can make routing adjustments before trips are executed rather than discovering the dead mile cost after the fact.
The Relationship Between Dead Miles and Account Profitability
One of the most important and most overlooked insights dead mile tracking reveals is the true profitability of individual broker accounts. On the surface, an account that sends you high trip volume looks valuable. But if those trips are geographically scattered in a way that generates consistently high dead miles, the actual net revenue from that account after dead mile costs may be significantly lower than a smaller account whose trips cluster efficiently in a single area.
Without dead mile data broken down by account, you cannot make this comparison. You might be dedicating significant fleet capacity to your highest-volume broker account while a smaller account with better geographic clustering is actually delivering better net margins per trip.
This is the kind of insight that changes how you negotiate account terms, how you prioritize scheduling capacity, and how you evaluate new broker relationships and it is only available to operators who track dead miles systematically.
What a 20% Dead Mile Reduction Actually Means for Your Business
To make the financial impact concrete — consider a fleet of 8 vehicles generating $40,000 per month in total revenue. If that fleet is accumulating dead miles equal to 25 percent of total miles driven, and average all-in cost per mile is $0.90, the monthly dead mile cost is approximately $4,500 to $6,000 depending on total mileage.
Reducing dead miles by 20 percent through geographic clustering, advance scheduling, and return trip pairing brings that monthly cost down by $900 to $1,200. Over 12 months, that is $10,800 to $14,400 of recovered margin — without adding a single new trip, hiring a new driver, or acquiring a new account. It is pure optimization of what your fleet is already doing.
For most NEMT providers, dead mile reduction is the single highest-return operational improvement available to them — and it costs nothing beyond the time invested in smarter scheduling and the software to track it accurately.
The Bottom Line
Dead miles are not an unavoidable cost of running a NEMT business. They are a scheduling and routing problem and like all scheduling and routing problems, they respond to systematic, data-driven attention. The operators who track their dead miles, understand which accounts and routes generate the most waste, and use that data to make smarter scheduling decisions consistently outperform competitors who are flying blind on their actual margins.
Start by measuring your dead miles this week. If your current system does not calculate them automatically, use ActiveRoute’s reporting suite to get an accurate baseline. Then apply geographic clustering, advance scheduling, and return trip pairing systematically and watch what happens to your margins over the following 30 days.
ActiveRoute automatically calculates dead miles across your entire fleet in real time by driver, by account, and by date range.

You May Also Like


Have any questions? Leave a comment below